 English
Remote debugging
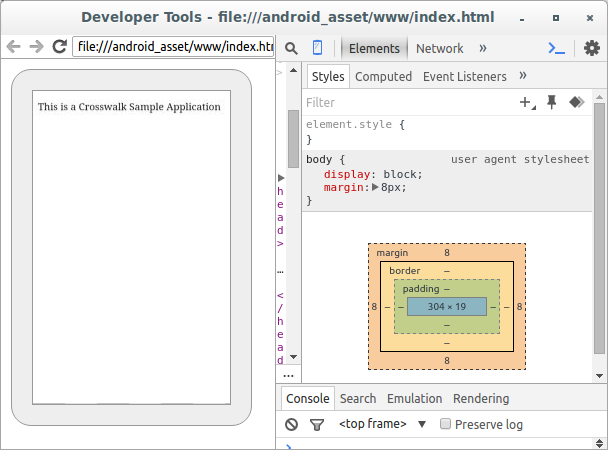
Web applications running under Crosswalk can be debugged remotely using the Chrome dev tools.
For best resuls, use the version of Chrome that matches (or is newer) the version used in the Crosswalk release you are using. See the mapping in the dropdown below.
On Android, the connection between the host and target is established using adb which is part of the Android SDK. You will also need to set up an Android target and install a packaged Crosswalk application on it. See these instructions.
Debugging on Android must be enabled during build time.
Enable debugging
crosswalk-app build
crosswalk-app buildaccepts "release" and "debug" as options. Debug is the default, so you don't need to add anything to create a debug version, although using "debug" may remind you that you should change the build before releasing the app.> crosswalk-app build [release|debug] [<dir>]cordova build
cordova buildalso defaults to creating a debug version. It accepts--debugand--releaseparameters.> cordova build android [--release|--debug]Embedding Crosswalk in your application
If you are embedding Crosswalk in your application using the Crosswalk embedding API (for example in a native application using the Crosswalk webview), you can enable debugging in your application code using the embedding API
Modify your application's main activity to set the remote debugging preference. For example:
XWalkPreferences.setValue(XWalkPreferences.REMOTE_DEBUGGING, true);Build the application package the usual way (e.g. using Ant or ADT).
Full details are given in the Crosswalk embedding tutorial
Install and debug
Install your application on the target:
> adb install com.abc.myappRun the application on the target by clicking on the application icon. More details
On the host, open a Chrome browser and go to "chrome://inspect" in the address bar. This should show a list of attached devices, with your application listed, for example:

Click on the "inspect" link to open the application for debugging with the Chrome dev tools.
Troubleshooting
adb can't connect to the device
You may occasionally find that
adbis unable to connect to the device, and remote debugging won't work. You can try unplugging the USB cable between your host and target (if using a USB connection), then reattaching it, which sometimes fixes the issue; or you could try runningadbas root.The application doesn't appear in the chrome://inspect page
If the application is not visible in the inspection page, use
adbto check that remote debugging is enabled for the application:host$ adb shell shell@android$ cat /proc/net/unix |grep devtools_remote 00000000: 00000002 00000000 00010000 0001 01 1102698 @org.crosswalkproject.app_devtools_remote 00000000: 00000002 00000000 00010000 0001 01 1092981 @org.xwalk.core.xwview.shell_devtools_remoteIf you cannot see any entries ending with
_devtools_remote, it's likely that remote debugging is not enabled for the application. Follow the steps above to either rebuild the application with remote debugging support, or switch remote debugging on at run time.
Further information
For information about using the Chrome dev tools for debugging, see this page.